A slow flow in the Iowa River
The Iowa River is an excellent example we humans can observe to help us grasp the intensity of drought-like conditions. The river’s water level is low and its flow rate is very slow, so at this point in an Iowa summer, that is not really unexpected or unusual in and of itself.
Obviously Iowa, during 2023, in general, has not had an ideal distribution of rain events. What we humans may call ‘ideal’ is not necessarily how Mother Nature might define the always chaotic interplay of weather systems that pass our way across North America. So our choice is to adapt, conserve where we can and take due note of the cyclical phenomenon of weather patterns.
Records and data from the US Army Corps of Engineers indicates the differences between August 2023 and previous intense drought years of 1977 and 1988. Why are those years being cited? Because 77 and 88 were highly correlated with sunspot cycles.
This is just one variation of energy output that astronomers have identified. Sunspot cycles have an average of about 11 years between its high and low ebbs. There may be a long term continuation of these solar events carried out for us in 2023.
I looked up the data from 1977 Iowa River flows. I found that during July of that year, the river flow level was lower than now.
In fact, the water stage was consistently showing numbers of 6.3 to 6.6 feet. One must remember that this gauge reading is just an arbitrary number. Anything lower or higher is relative to the reference point used by the Corps of Engineers who likes to keep tabs on all the river flow rates in every watershed in the United States.
Then during August 1977, some rains returned, and runoff into the river increased slowly at first and then with a surge on Aug. 17 from a few heavy rains. Thus, the gauge responded with a reading crest of 15.92′. This somewhat high water quickly receded to 9′, then 8′ and down to 7.70′ by the 26th of the month.
Eleven years later, during July and August of 1988, rains were non-existent. The Iowa River data from that time showed stages on average for July of 7.4′ to 7.5′. August was about the same with somewhat lower water levels that averaged 7.1′ to 7.2′.
Fast forward to August 2023, and we can explore the data being added to the history ledger. On Aug. 1, the river gauge reading was 10.50′ and has slowly and steadily decreased until today with a gauge reading of about 8.9′. Note how today’s numbers compare to those of 1977 and 1988. We have a ways to go before reaching truly record drier years.
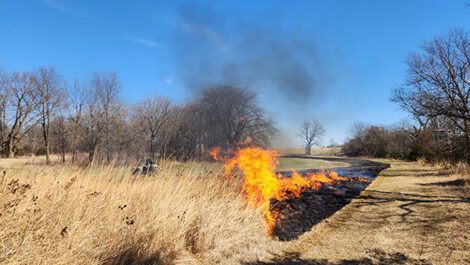
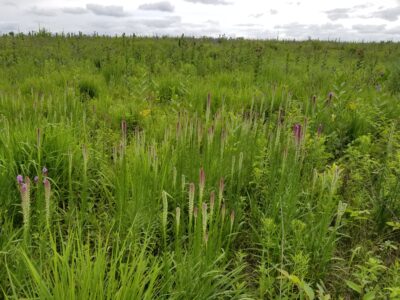
During each low flow time, sand bars that were left exposed to sunlight long enough allowed weed and other vegetation types to germinate, greening up the surface of the sand. Today’s image shows the same thing, green sand bar tops, and the current flow meanders wide from
shore to shore as it seeks its pathway downstream.
If you want to wade across the river at Timmons Grove, you will get your ankles wet. Water is shallow as of now.
This author recalls and vividly remembers 1977, 1988 and all the in-between times of moderate river flows and lots of truly high flood river events. The cyclical nature of weather events just proves how unpredictable and fickle atmospheric systems can be from year to year, and decade to decade.
While many headline grabbing media outlets want to falsely point their fingers at natural events as so-called ‘proof’ of man-made climate change, the truth is different. There is a complex explanation for weather patterns in the northern hemisphere this summer. Multiple geologic, solar, meteorological and atmospheric events have occurred simultaneously which resulted in higher summer air temperatures over much of the world.
——–
Earth is a fascinating planet. Its cosmic and geologic history tells a tremendous story of time measured in billions of years. One factor that tells both a primitive as well as a modern-day story of birth and decay can be found in volcanoes.
Therefore, a closer look at the volcano I noted that erupted deep underwater on Jan. 15, 2022, is in order. The natural history of planet earth is full of clues and rock records of long ago times when volcanic activity both on land and under the oceans helped shape our planet.
The interior of the earth deep inside the mantle is a boiling mixture of silica rich minerals. From time to time, this ‘teapot’ has to let off steam. It is natural for the earth to vent periodically to let
off pressure.
Earth’s tectonic plates continually stretch, subduct, recycle and move across the upper mantle. Most earthquakes, and to a large extent most volcanoes, can be found on or close to plate boundaries.
In the South Pacific Ocean, the eruption of Tonga-Hunga blasted an enormous amount of water vapor into the atmosphere, specifically the stratosphere, between eight to 33 miles above the Earth. The sheer amount of water vapor added has scientists studying how this temporary yet influencing effect will cause summer air temperatures to spike this summer.
One estimate for the amount of water vapor pegs it at 146 teragrams. One teragram is equal to one million grams, or, put another way, 146 teragrams is like adding a new 10 percent or more of water vapor to the natural water vapor already existing in all of earth’s atmospheric realm. Data from a satellite operated by NASA called the Microwave Limb Sounder measures atmospheric gasses including water vapor and ozone. After Tonga-Hunga erupted, a huge spike in water vapor data was observed.
How this all plays out will be an interesting scientific discovery process.
——–
I have used this quote a few times in past issues of Outdoors Today. It goes like this: “There are no simple solutions to complex problems.”
Or, put another way long ago by H. L. Mencken — “For every complex problem, there is an answer that is clear, simple and wrong.”
Climate change is a long-term complex phenomenon. Weather is a short term condition.
——–
Garry Brandenburg is the retired director of the Marshall County Conservation Board. He is a graduate of Iowa State University with a BS degree in Fish & Wildlife Biology.
Contact him at:
P.O. Box 96
Albion, IA 50005
-

- PHOTOS BY GARRY BRANDENBURG — The Iowa River is flowing but at a very slow rate. According to data from historical records from the US Army Corps of Engineers, the river was lower and slower in 1977. The cubic flow rate averaged about 75 at the Corp’s gauge location on highway 14 during 1977. This past week the flow rate was a little higher, but not by much. Drought conditions this summer have been intense. A variety of natural causes, a strong El Nino, and somewhat cyclical astronomic variation from our Sun’s energy output have researchers evaluating data. Plus this factor: ocean circulation patterns of the North Atlantic. Now add to these factors an undersea volcano named Hunga Tonga-Hunga Ha’apai that erupted in January of 2022. This undersea eruption injected a huge amount of additional water vapor into earth’s atmosphere. Water vapor is a natural product of evaporation and then precipitation, and it is a greenhouse gas. Today’s aerial image shows the Iowa River at Timmons Grove during mid-June of this year when sand bars were at or just below the water. The ground level image is of the same Timmons Grove area with small weedy vegetation greening up exposed sand bars.